
More Deal Options Than You Realize: A Summary of USA Deal Activity by Financing Capital Type
If you only watch private equity and venture headlines, you are seeing the $$$$$$$$$ capital dollars, but missing the deals. The largest volume of USA transactions does not run through PE or VC — it runs through SBA-financed small-business acquisitions, where deal counts are high and average check sizes are small. Below is a summary of USA deal counts and amounts by type of where the deals actually are from small business “Main Street” to “ Wall Street.
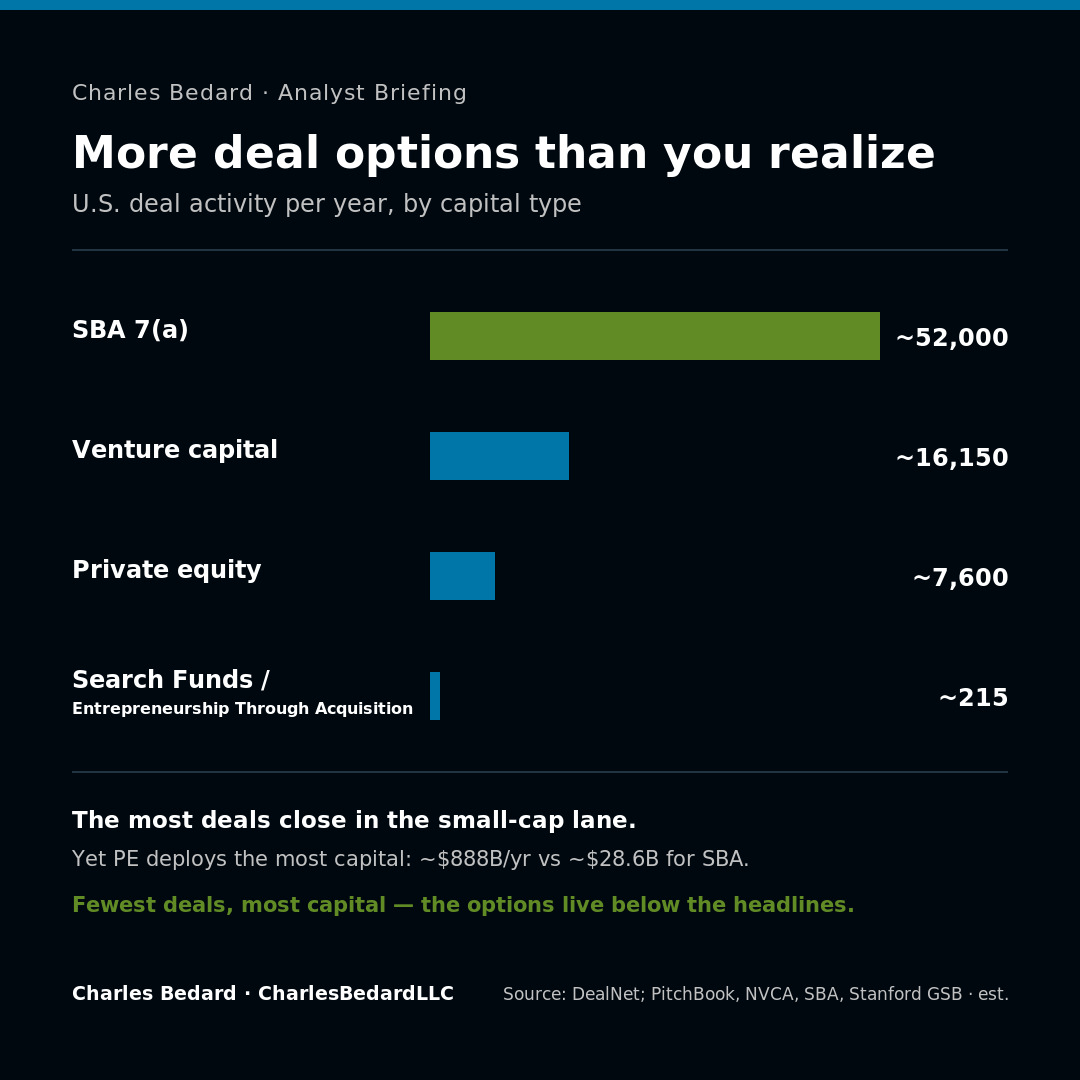
How many deals actually happen in the USA each year, by capital type?
Far more than the PE/VC headlines narrative suggests — the channel source of financing capital inverts when you compare count to capital. Private equity does the fewest deals for the most money; SBA lending and ETA (“Entrepreneurship-through-Acquisition”) do the most deals for the least
The deal volume lives below the headlines
Most USA transactions close in the small-cap, SBA, and ETA lanes — not in PE or VC.
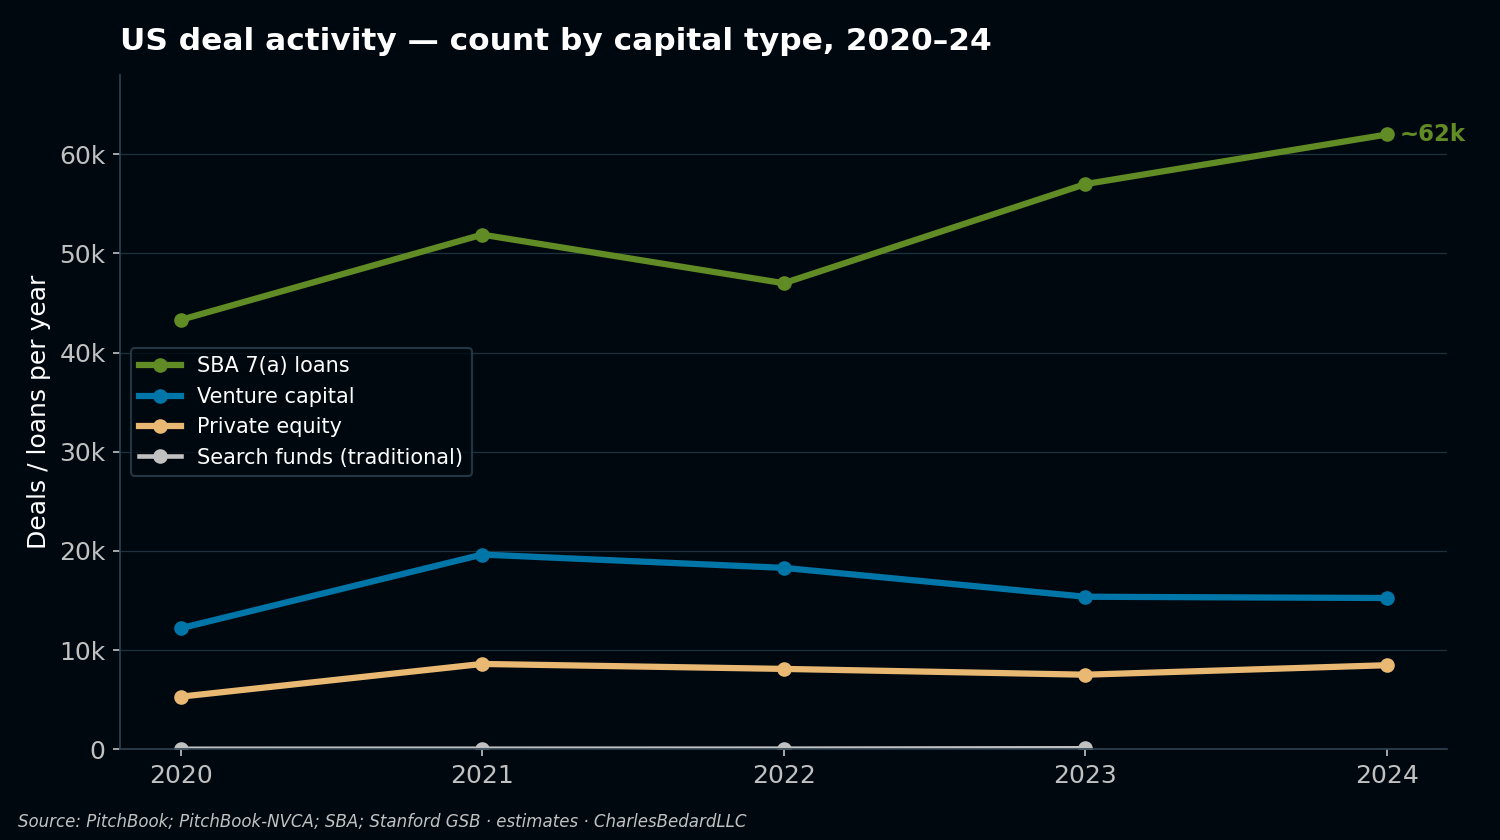
Volume by channel has only widened
SBA-financed activity dwarfs PE and VC deal counts and has climbed since 2020.
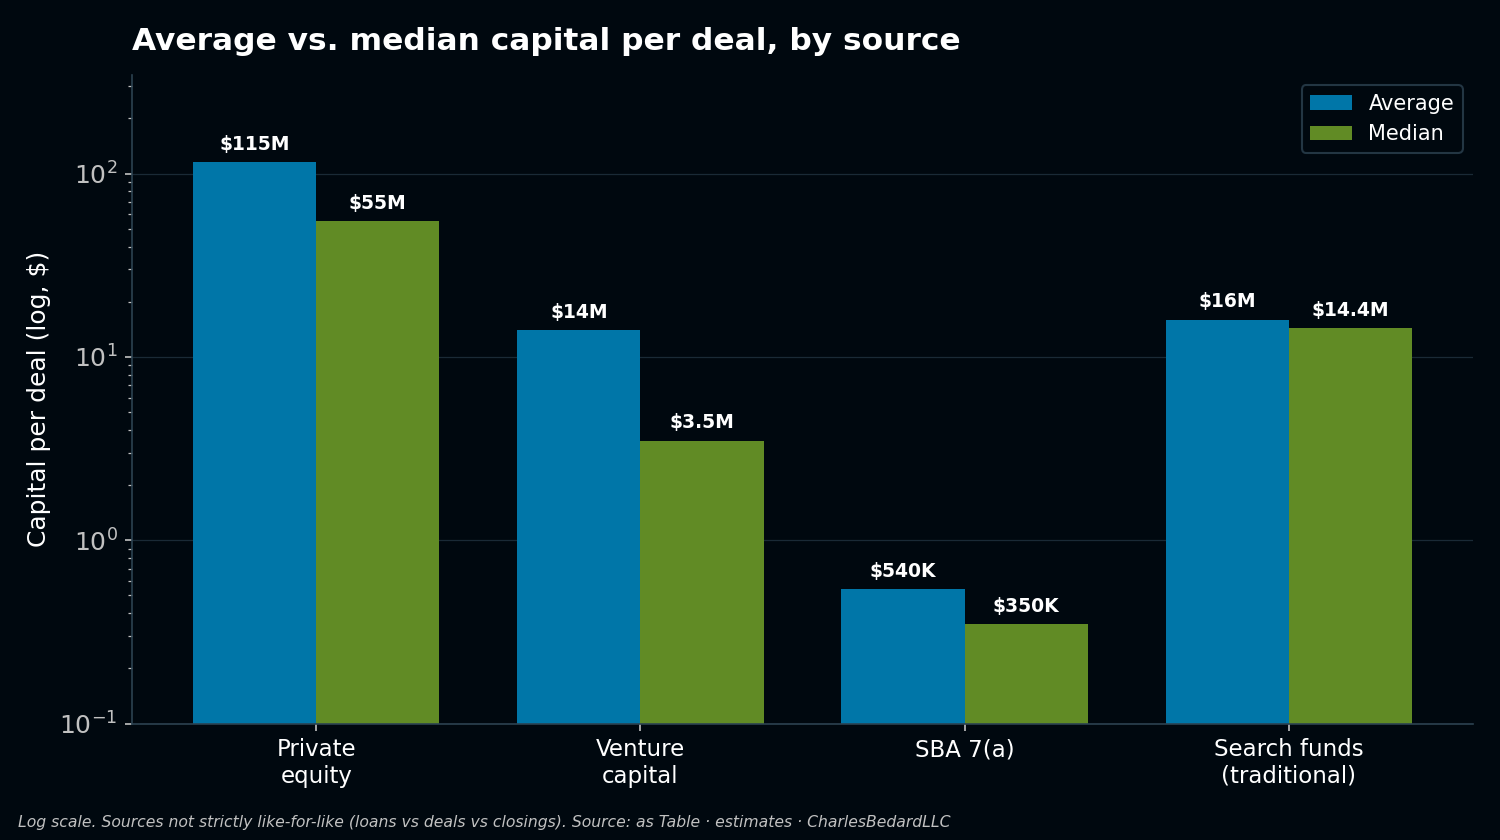
The typical deal is far smaller than the average
PE and VC averages are inflated by a handful of giant deals; search funds are the tightest, most predictable check.
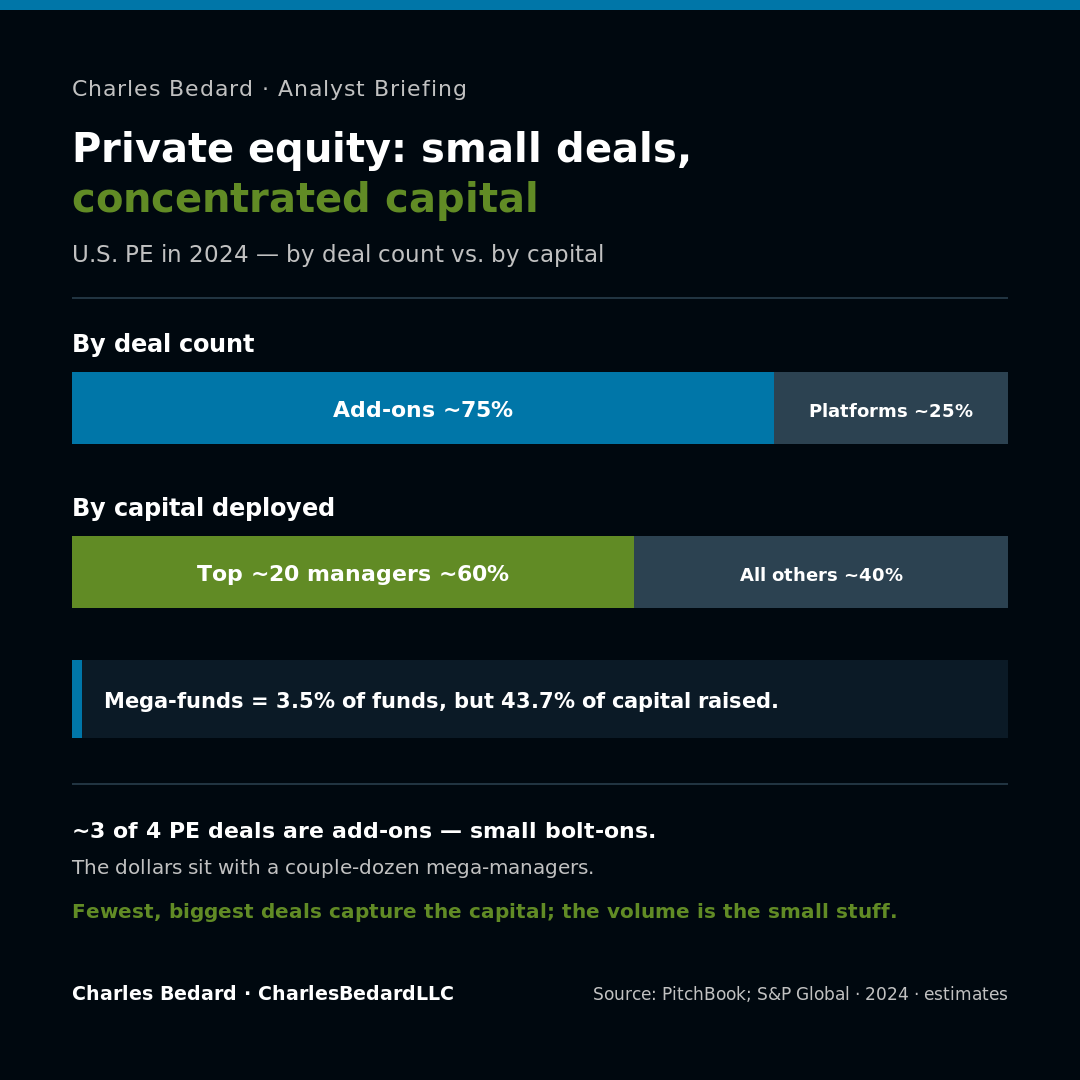
Private equity: small deals, concentrated capital
Roughly 3 of 4 buyouts are add-ons, yet the top ~20 managers deploy most of the capital.
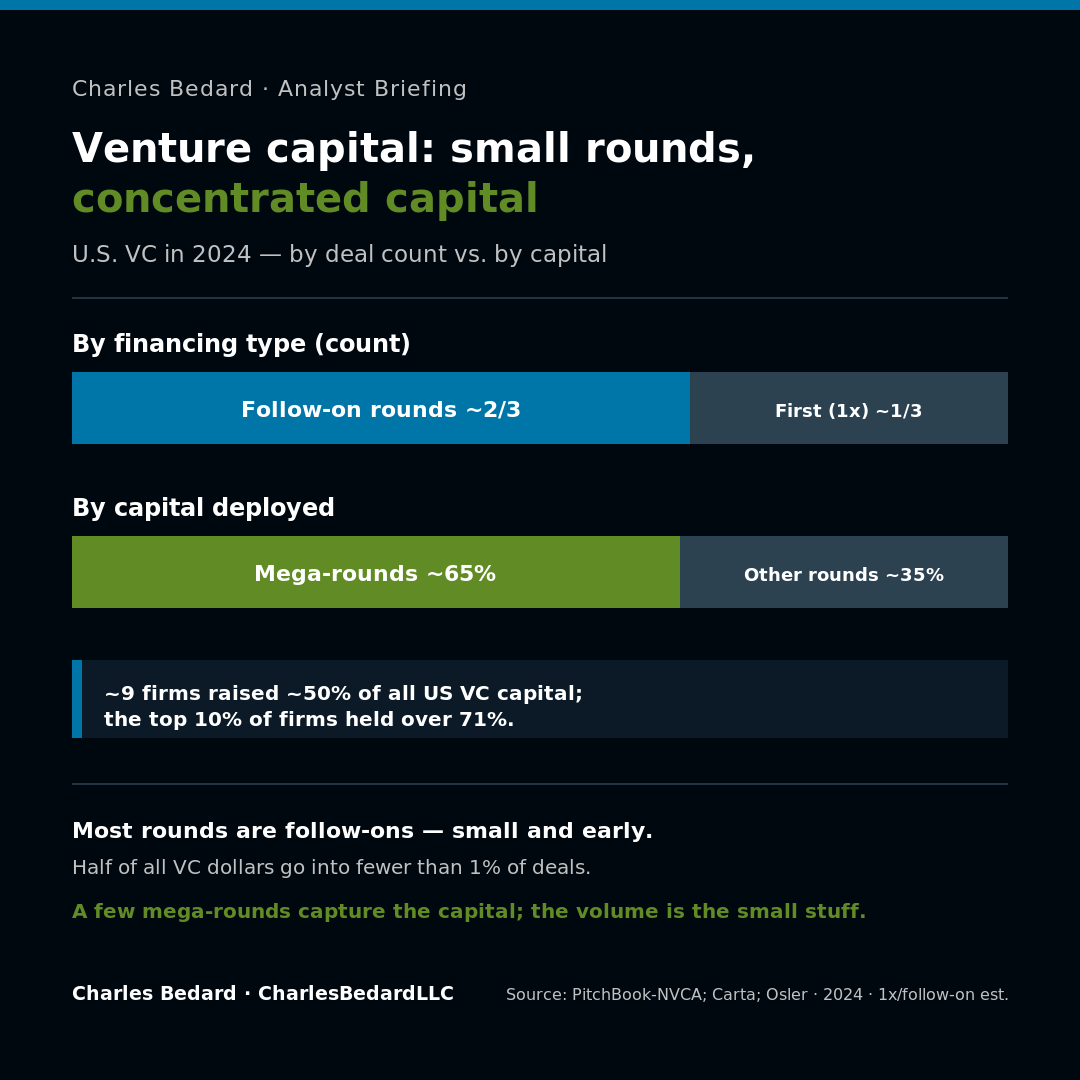
Venture capital: small rounds, concentrated capital
Follow-on rounds dominate by count, but mega-rounds capture roughly 65% of the dollars.
What does a “typical” deal look like by source — average vs. median?
It depends entirely on whether you measure the mean or the median, and the gap between them is the story. For the skewed channels (VC, PE), a handful of mega-deals pull the average well above the typical deal. SBA is the steadiest. Note the search-fund line is split into the traditional (hard-tracked) segment and the full ETA universe.
What does this mean for where the real deal options are?
The actionable opportunity is wider and lower than the PE/VC headlines imply.
Measured by volume, self-funded ETA and SBA-financed acquisitions drive the most closings every year, at small average enterprise values ($1–10M). Traditional and accelerator-backed deals are a smaller, more visible slice (~100–125 combined closings) that capture the larger, recurring, tech-enabled B2B profiles. Private equity sits above all of it on capital but below all of it on count.
For an operator, searcher, or acquirer, that means the white space is real: a tight, repeatable ~$14M traditional search-fund profile, a ~$5–8M self-funded lane, and a ~$350K–$540K SBA channel that together represent the largest pool of physical deal options in the market — most of which never reach a headline.
Who actually captures the capital? PE and VC are barbell-concentrated
The capital headlines are even narrower than they look — a handful of mega-funds and mega-deals absorb most of the dollars, while the deal count sits in small add-ons and follow-ons. That concentration is the structural reason the accessible options live downmarket.
Private equity — most deals are add-ons, most dollars are mega. Add-ons are roughly 3 of every 4 US buyouts (~75–76%); platform deals are only ~25%. Yet capital is concentrated at the top: mega-funds (≥$5B) took 43.7% of all PE capital raised in 2024 while being just 3.5% of funds, and about 60% of capital went to the top ~20 managers. Ten mega-funds closed a combined $124.4B, and 18 mega-deals ($5B+) were completed — more than double 2023.
Venture capital — follow-ons by count, mega-rounds by dollar. Follow-on rounds are the majority of deal count; first (“1x”) financings are the declining minority. On value, the concentration is stark: mega-rounds (~738 deals) captured roughly 65% of all VC dollars in 2024, half of all VC dollars went into fewer than 1% of deals, and the top 10 companies held over 40% of value. On the raise side, about 9 firms took ~50% of all US VC capital, and the top 10% of firms controlled over 71%.
Both PE and VC are top-heavy on amount of capital deployed to a few mega deals and volume is a long-tail count. The majority of USA deal volume are in the far more accessible entry points across PE add-ons, VC follow-ons series B-E, and the SBA/ETA categories, not in the mega-deals that make the news headlines.
***There are also Family Office investors, Value Buyers, Holding Companies, Investment Funds, Alternative Asset Allocators, and many niche investor options.
Download the tables and visuals DocSend