
What is the Playbook for Solutions to capture market share?
Who is Capturing AI Market Share Executive Summary?
Capturing 10% of the combined market today; but widely varies across horizontal functions and by industry vertical niche. Fastest growing use cases include Data into Intelligence Actions, Productivity Enablement, and Collaboration.
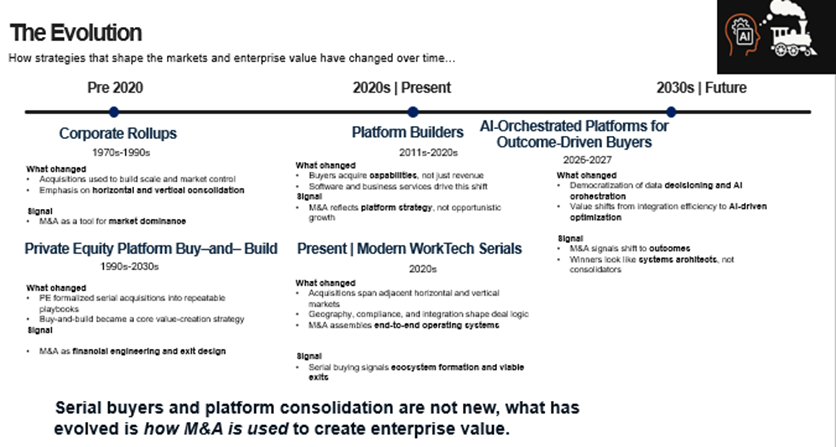
The investor-backed playbook has moved beyond private equity LBO buyouts and industry consolidation plays to sophisticated growth equity playbooks designed for the next era and supported by operating layers.
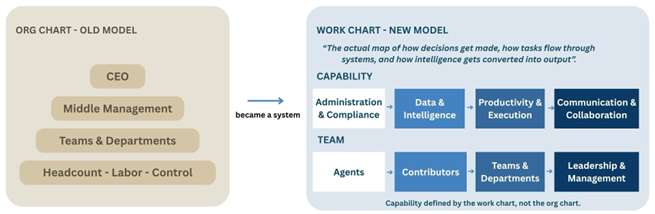
The work flow chart changing the org chart.
What is the USA Market Size for Solutions to capture market share from SaaS and Services?
Both software and services face competition from solution models that deliver outcome beyond usage revenue pricing and tech-enabled solution delivery.
- SaaS software multiples have declined due to the threat of both new competitors as well as risk of alternative revenue pricing models;
- Services face the pressure to increase productivity and deliver differently.
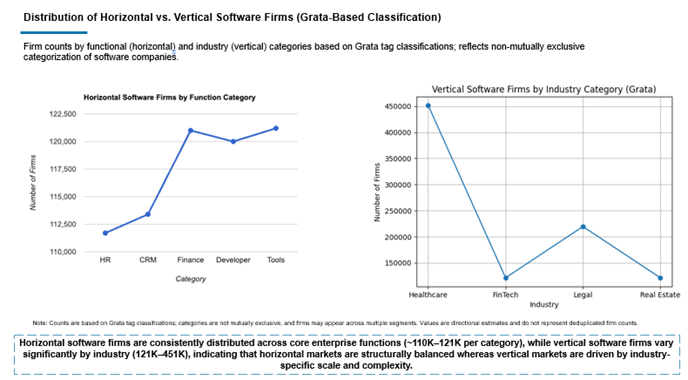
The USA Software Industry Market Landscape Snapshot
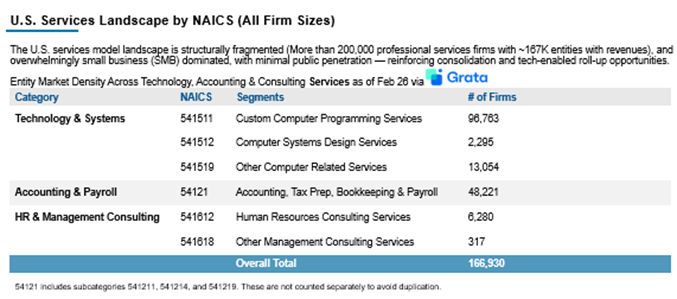
The USA Services Industry Market Landscape Snapshot
The Solution Model Playbook for the Agentic AI Era for Investors
The Solution Model Playbook for the Agentic AI Era for Entrepreneurs
The Organization Didn’t Disappear. It Changed Shape.
Will the future org chart be obsolete?
Here’s a claim that’s been making the rounds in business circles news: you know longer need a full organization to operate like one. Tools have replaced teams. AI has replaced managers. The org chart is dead.
Sure, it’s a compelling headline. And like most compelling headlines, it’s partially right.
The pyramid we inherited from the industrial era is giving a way to something flatter, faster, and more platform-dependent. And understanding why that’s happening requires looking at the operating layers that are redesigning how work gets done.
The constraint is no long building a labor dependent team. It’s designing the system that gets the work done. Organization still exists but capability is now defined by the work chart, not the org chart.
The Question to Ask Your Organization
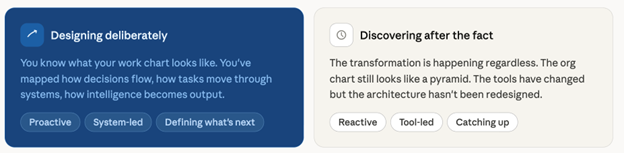
The most important chart in your company is no longer the org chart. It’s the work chart the actual map of how decisions get made, how tasks flow through systems, and how intelligence gets converted into output. Every business leader is already sensing this. The question isn’t whether WorkTech is transforming their organization. It’s whether they’re designing the transformation deliberately or discovering it after the fact.
Revenue per Employee: What the Numbers Reveal
Among early-stage firms with estimated revenues between $5M and $50M, labor efficiency varies significantly. Technology & Systems and Accounting & Payroll both achieve median revenue-per-employee figures around $160K, while HR & Management sits at $120K at median. But to put these average vs top quartile performer numbers in context, the trajectory of top-quartile private firm performance tells a clear story. (Source: Inc5000 award winners)
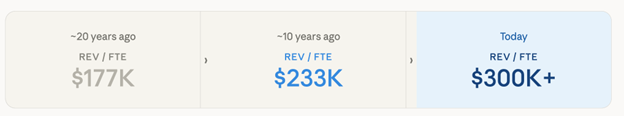
That is near-doubling over two decades driven not by sector tailwinds, but by deliberate shifts towards standardization and technology-enabled delivery. What was once elite performance is now a table stake for competitive operators.
"Revenue labor efficiency is driven more by service model delivery team structure than function — standardized, technology-enabled services achieving scalability well beyond $300K revenue per employee."
The implication: the ceiling isn’t in the service; it's in the model. Firms that standardize workflows and embed technology in their delivery layer can escape the linear headcount-to-revenue trap. The historical arc makes these concrete operators who moved early capture the gains; those who waited are now playing catch-up. What used to be exceptional ($233k/employee) is now below average. If you’re not moving toward $500k+ level, you’re falling behind and not standing still.
What This Means for Operators and Investors
Three themes emerge from the data in this playbook:
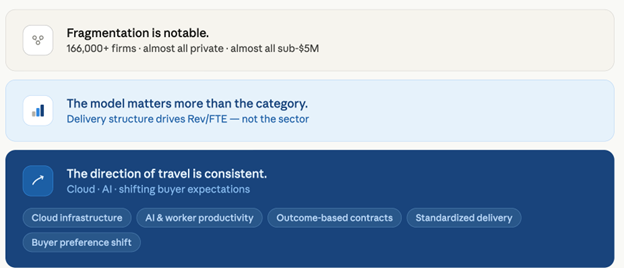
Fragmentation is notable. With over 166,000 classified firms almost all privately held, almost all sub-$5M in the market is highly fragmented with minimal institutional ownership. We believe this structural reality makes it worth examining consolidation and roll-up strategies, though the playbook data alone does not validate specific valuation assumptions or deal with flow outcomes.
The model matters more than the category. The data is clear on this: revenue per employee is driven more by how standardized and tech-enabled a firm's delivery model is than by which sector it operates in. When evaluating firms, model maturity deserves as much attention as top-line revenue.
The direction of travel is consistent. AI plus shifting buyer preferences are all cited as forces pushing toward BPaaS and tech-enabled recurring delivery. We believe firms that move in this direction are better positioned though how quickly the broader market follows remains to be seen.