
YTD: What Actually Happened to Multiples in 2026
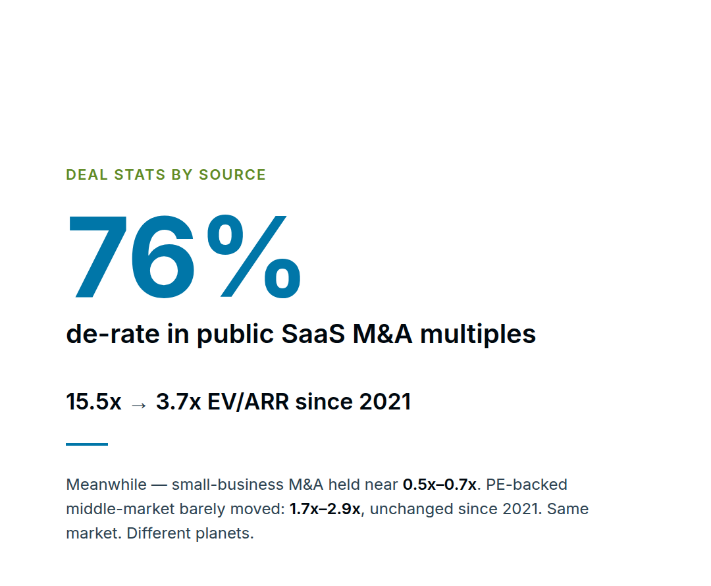
At the end of 2025, the public SaaS Capital Index[1] of publicly software businesses closed at 5.58x EV/ARR. By the end of July 2026 —it's sitting at 3.82x. That's a 31.6% decline in seven months, and the shape of that decline matters as much as the size of it.
January held roughly steady: 4.81x, down a modest 14% from December. Then February broke — 3.62x, a 25% drop in a single month, the sharpest move in the series. From there the index spent the spring bouncing along a narrow band (3.2x–3.7x) before ticking back up to 3.82x in July. In other words: this wasn't a slow bleed. It was one bad month that reset the public market, followed by four months of finding a new floor.
For large PE investor backed firms, the reset was slower to be realized cascading down market in the spring to the smaller PE reset starting summer. For early-stage and private/bootstrapped entrepreneurs the reset is still not recognized and corrected.
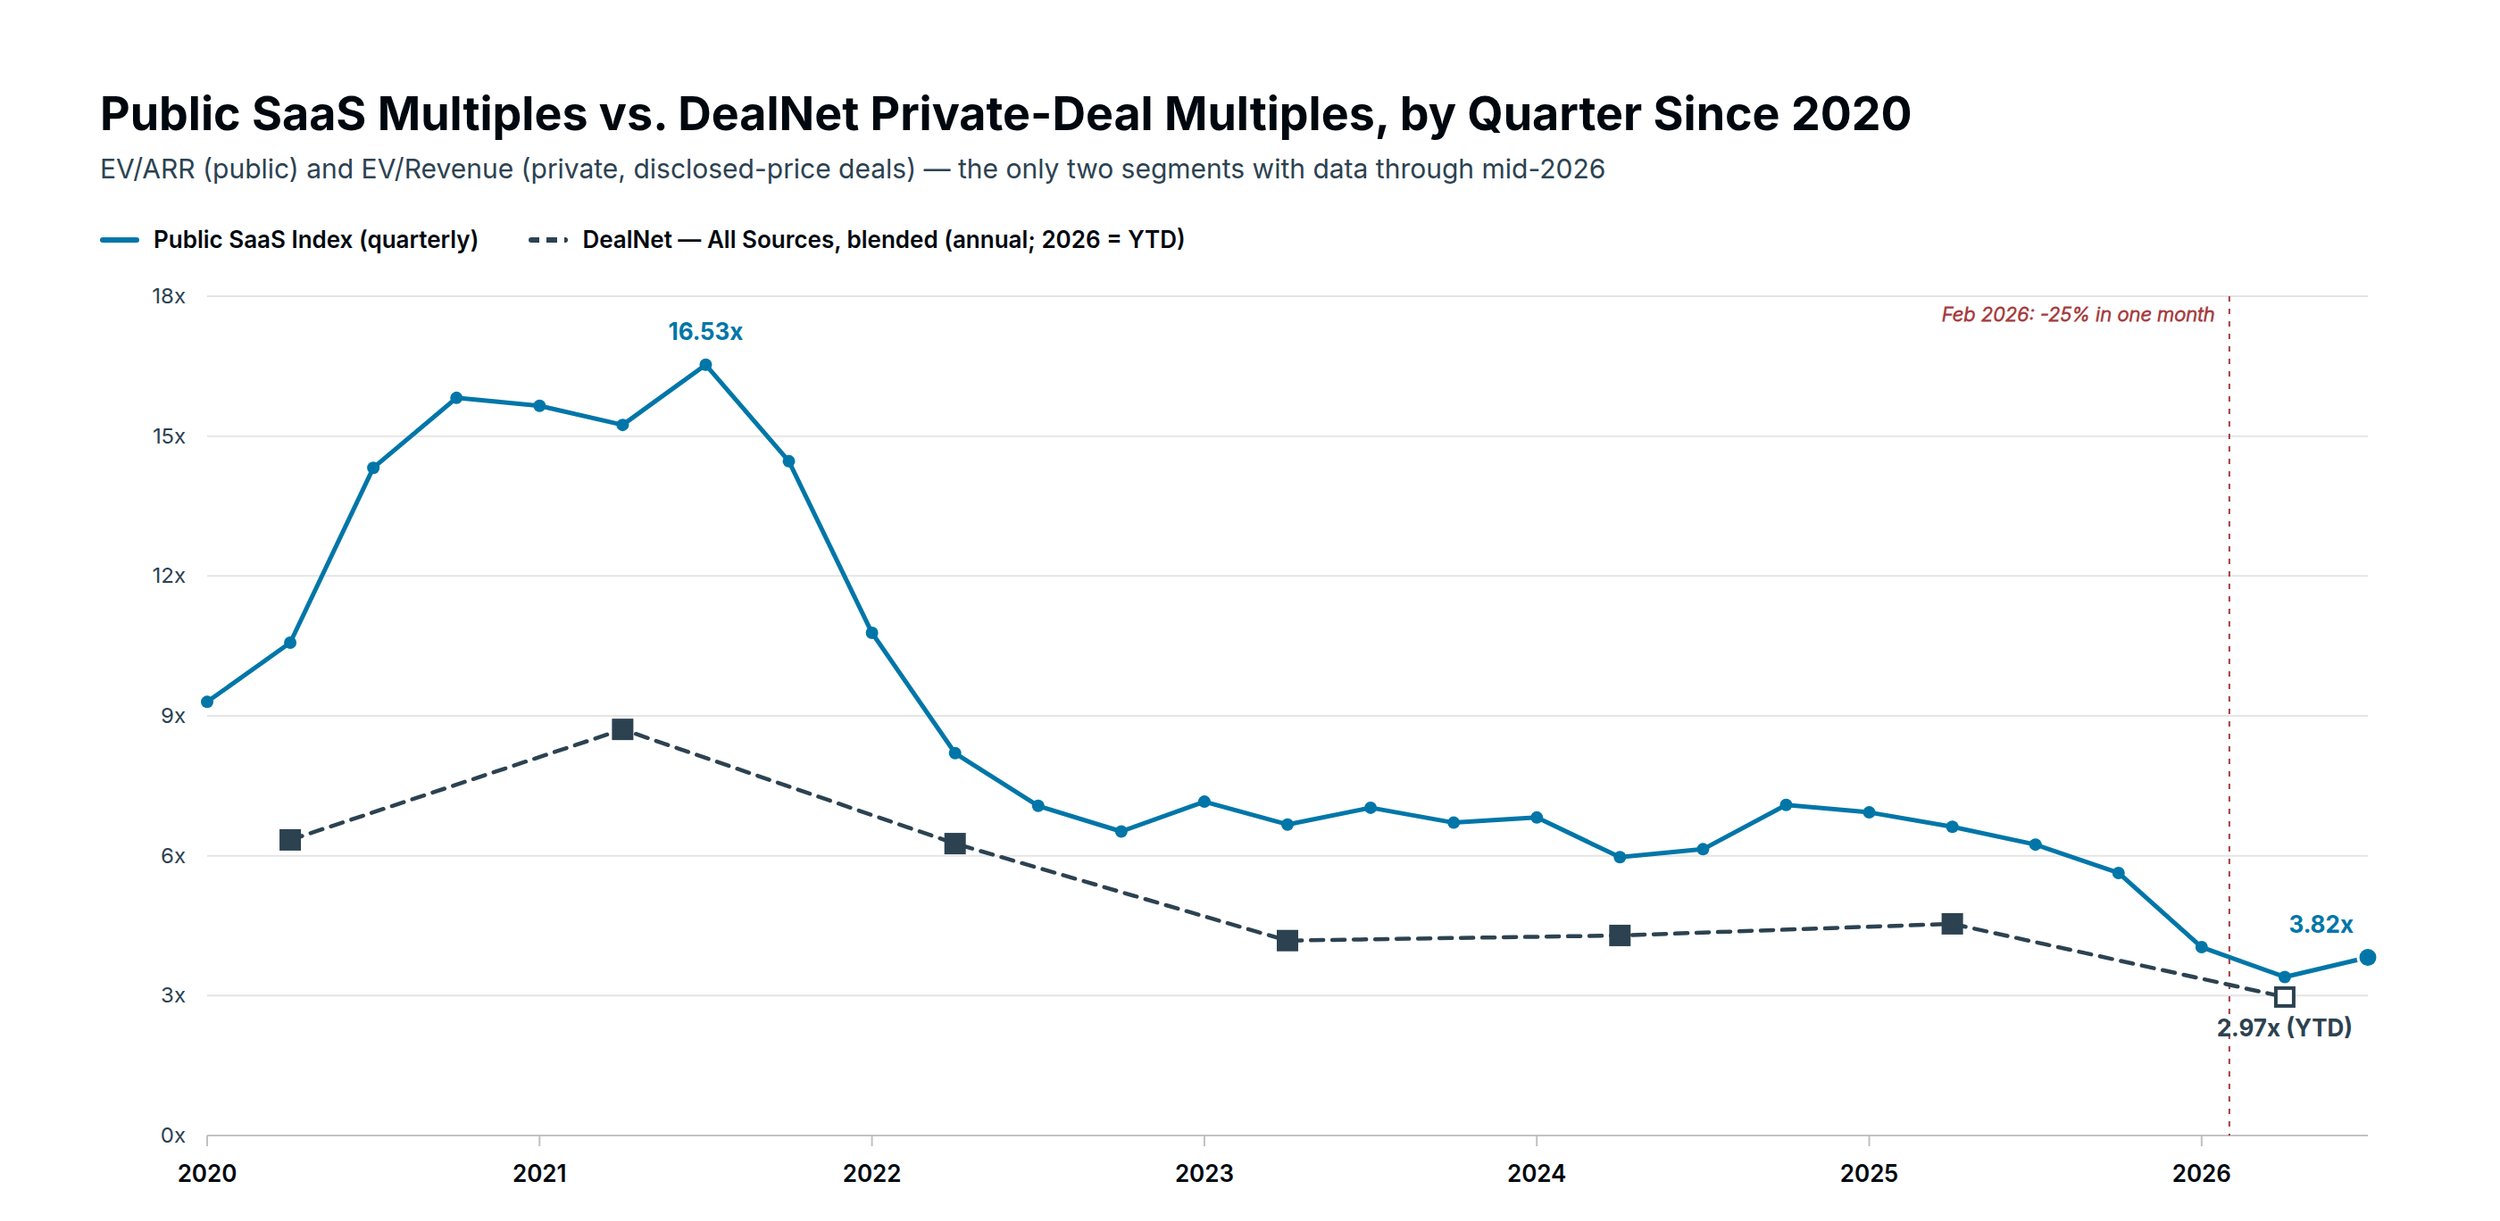
Zooming out to a historical comparison view, the chart below puts that reset in context: the 2020–21 boom that peaked at 16.53x in Q3 2021, the 2022 correction down to the 6x–7x range, roughly two years of relative stability through 2025, and now this second leg down in 2026 — the first sustained move below the post-2022 floor.
Averages are useful, but this year's compression has been making headlines. A deal that represents the reset: On August 4, 2026, Airtable sold to Bending Spoons — a roll-up holding company buyer known for aggressive cost-cutting — for a $1.285B enterprise value, roughly 2.7x its ~$480M ARR. That's down from an $11.7B valuation at its December 2021 Series F peak, an ~89% markdown, and well below the private-software norm of roughly 4.5x–5.3x revenue cited alongside the deal. For a company that once symbolized the no-code SaaS boom, the sale is confirmation that AI-native competition and slower enterprise budgets had caught up with a horizontal productivity tool.
Across the market, there is a K-Shaped deal reset rather than a uniform de-rate and more like a bifurcation: AI-disrupted horizontal tools getting marked down hard, entrenched niche and mission critical vertical platforms are still commanding real premiums, and the market's largest players testing whether going private is the more rational path than staying public through the correction (Thoma Bravo acquiring DayForce[2], and Internet speculation for Silve Lake acquiring Workday take private transaction).
The private markets moved too — just later and less violently.
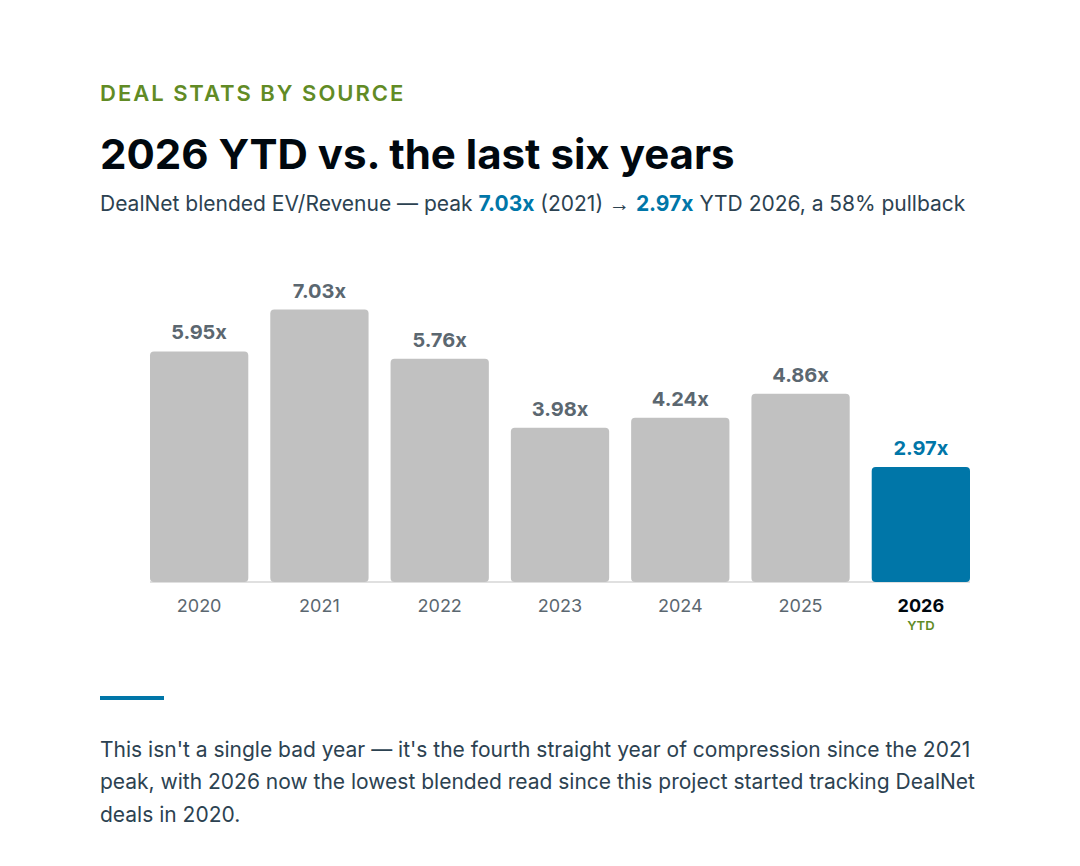
DealNet's blended read across disclosed-price deals with a computed multiple went from a 4.54x average in 2025 to 2.97x year-to-date 2026 — a 34.6% decline, in the same direction and roughly the same magnitude as the public move.
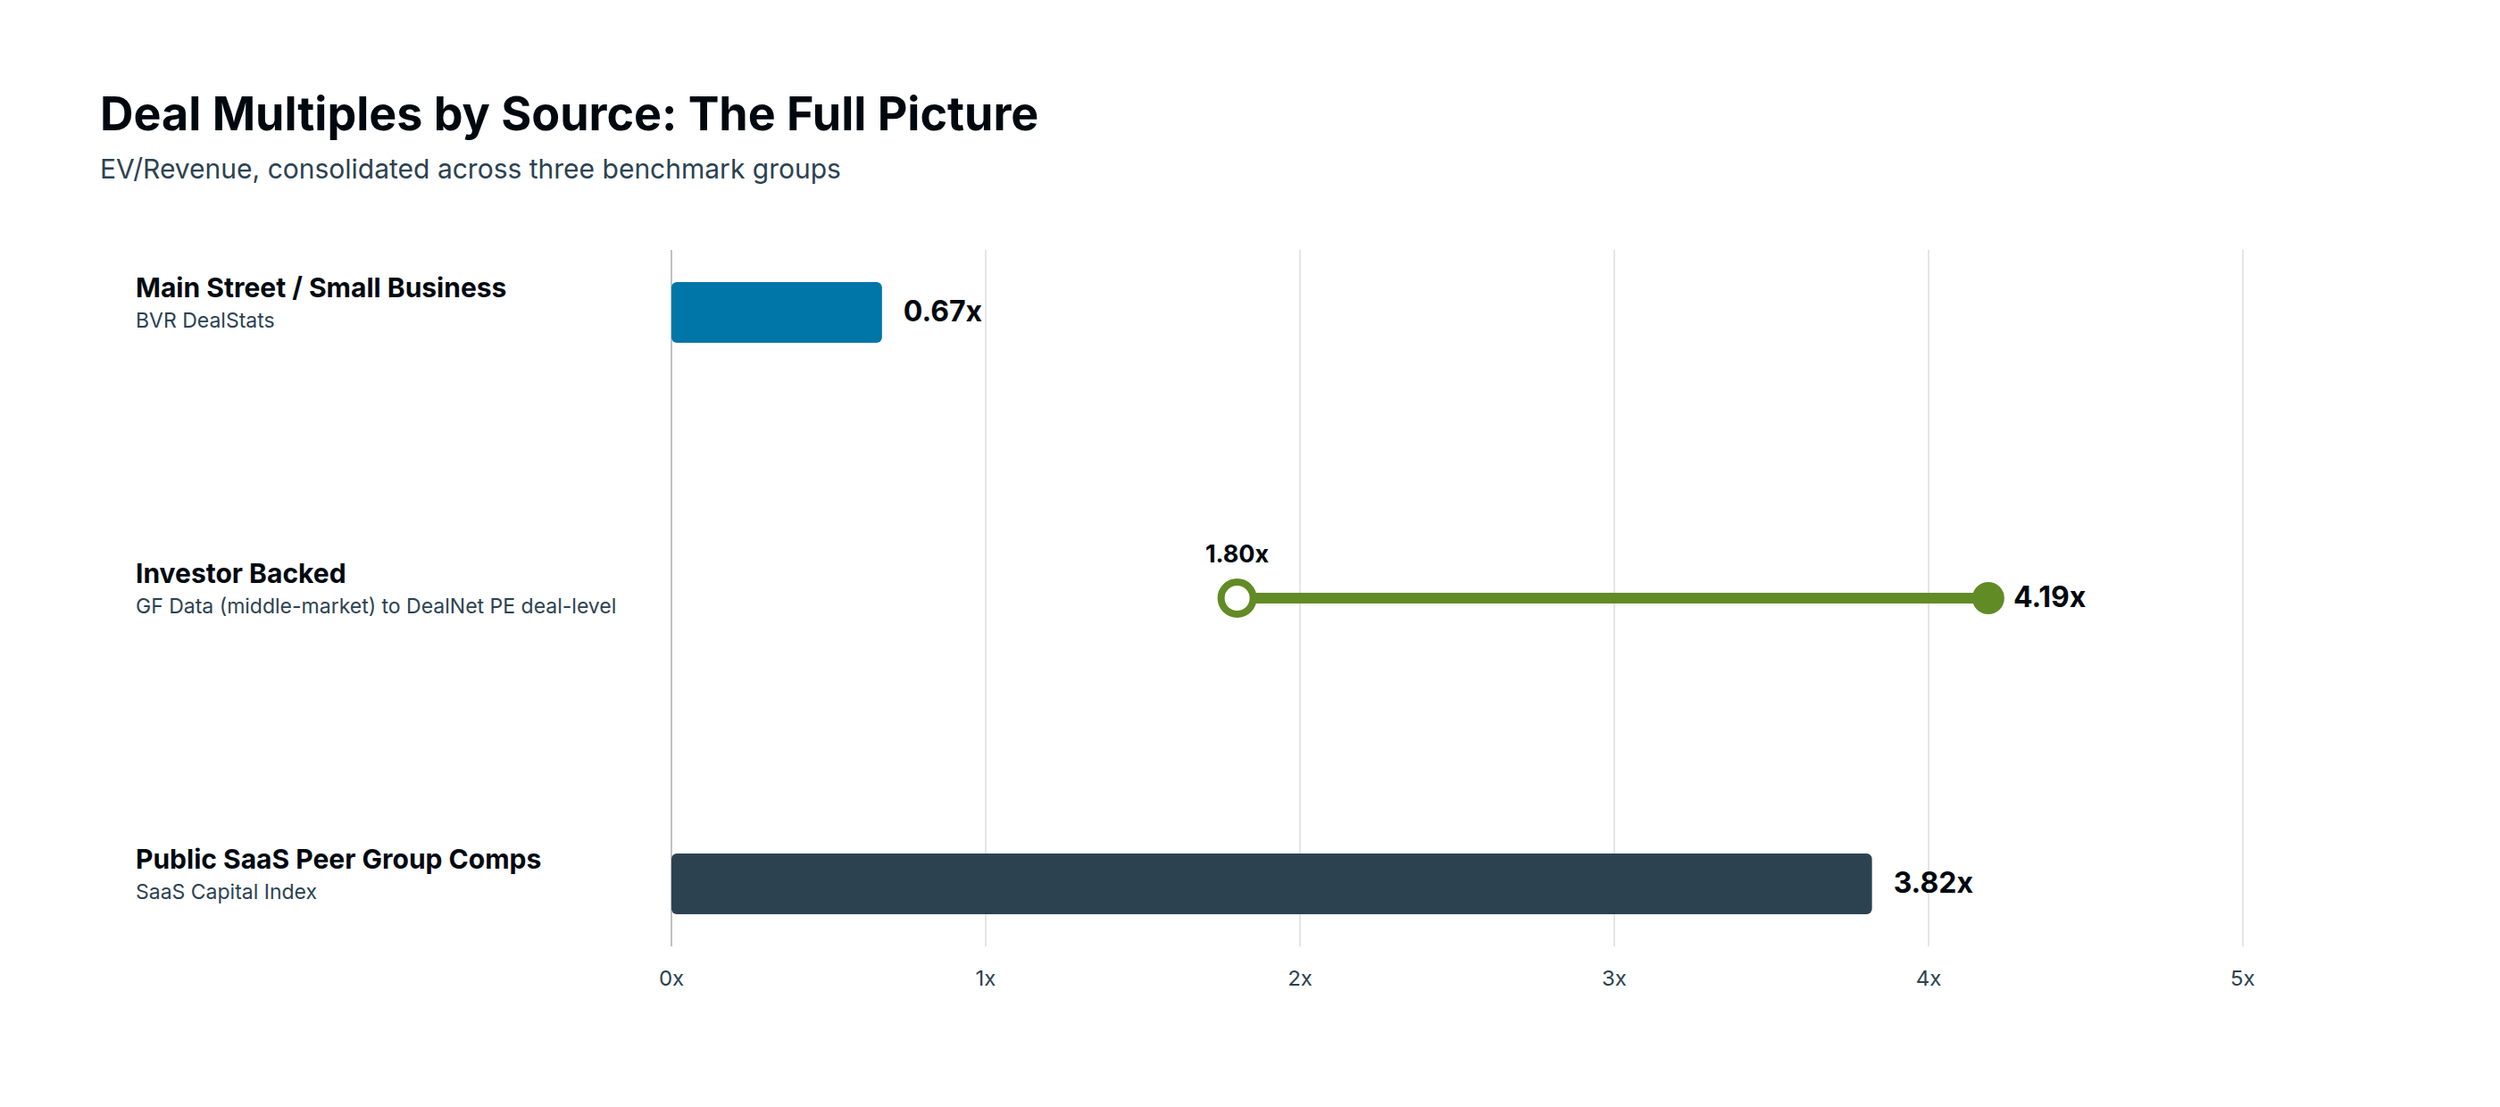
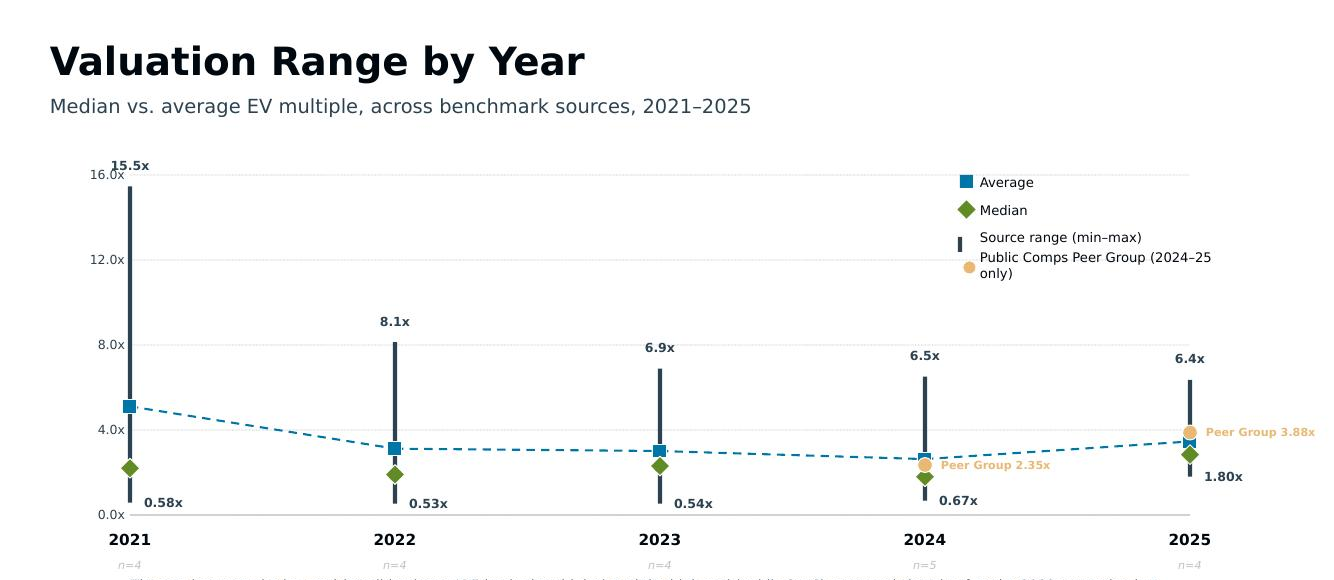
The full picture: by source valuation multiples range.
If you're evaluating a private deal using a public comp, the public correction front-ran the private one by at least a couple of quarters based— worth factoring into how much of the public reset has actually worked its way into private pricing yet. And if you're a Main Street or middle-market operator wondering whether any of this touches you: yes, the reset is real.
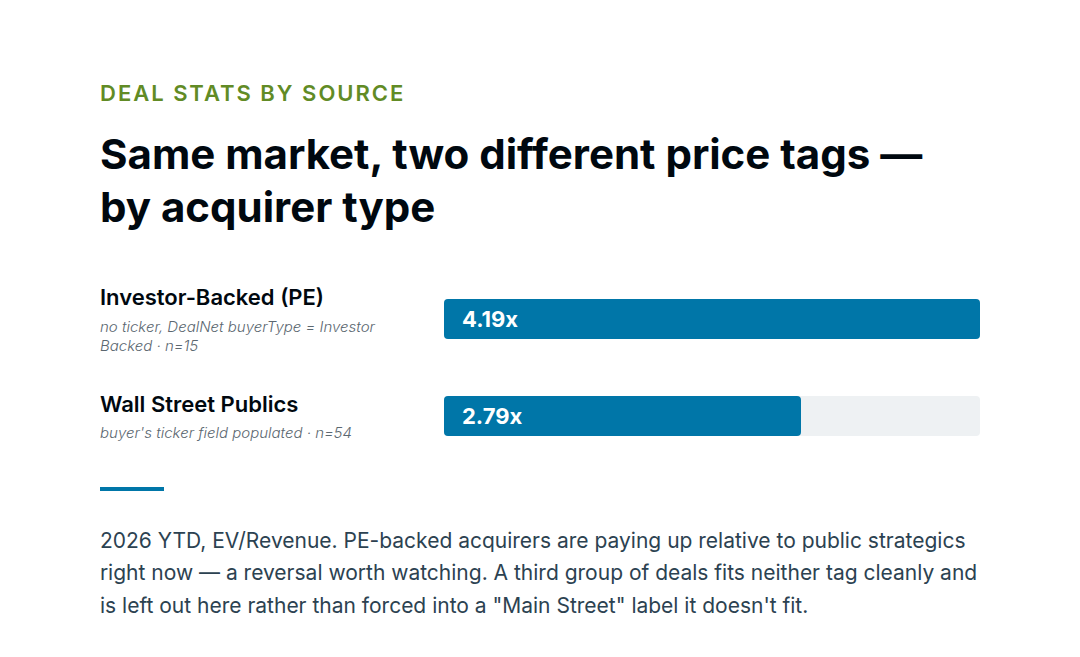
Wall Street Publics vs Investor-Backed (PE)
While multiples bifurcated K-Shaped; deal volume has increased.
Thousands of deals per year from small business Main Street to many types of investors (Abundance of capital driving increasing deal volume).
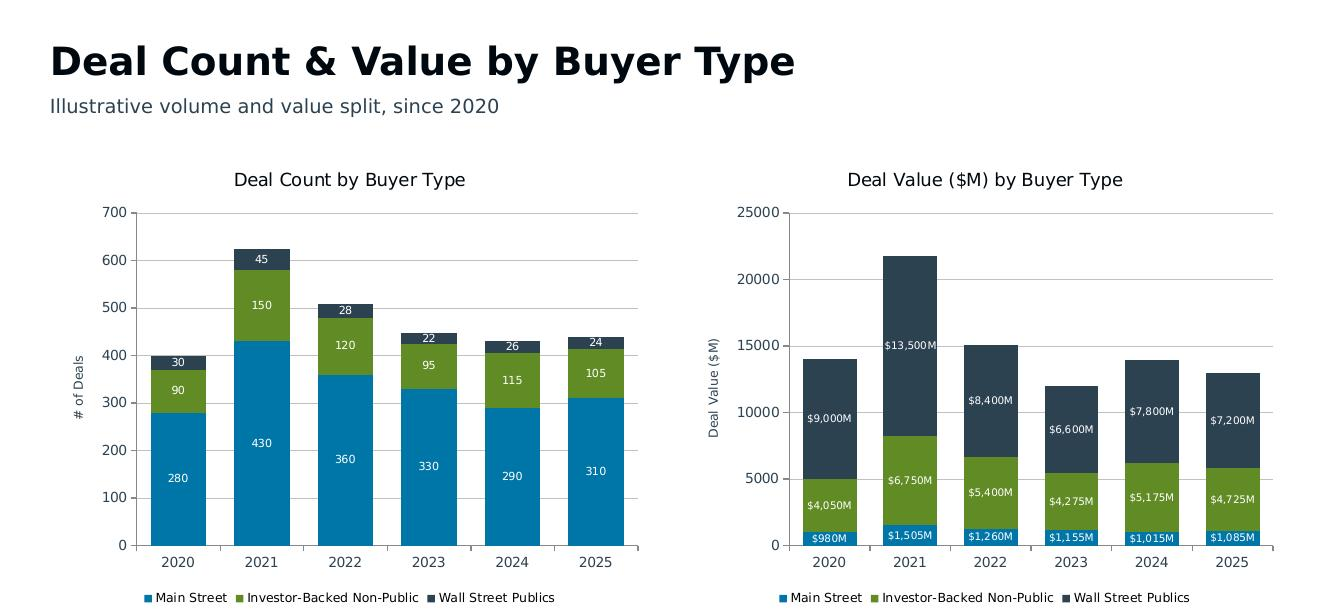
Wall Street Publics close the fewest deals of the buyer types shown but still account for roughly half of total deal value — the same multiple gap playing out in volume terms.
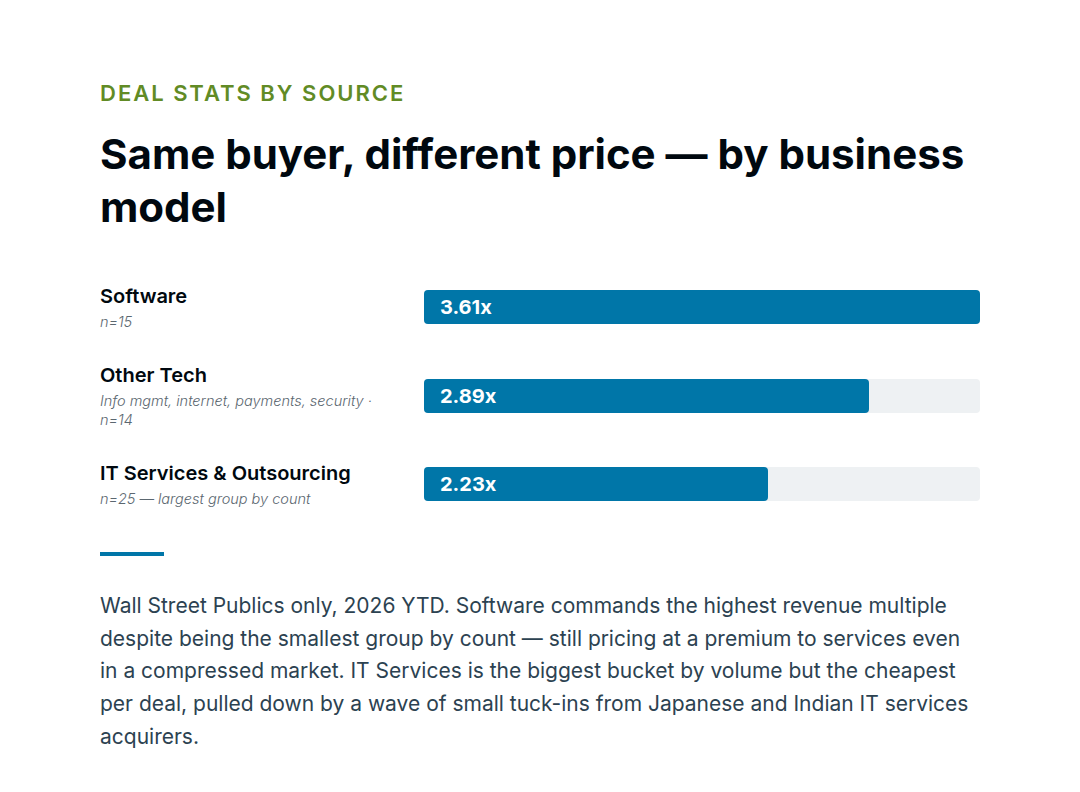
Where the Market Stands — 2026 YTD
Capital is concentrating hard into AI, at both the investment funding and the M&A level, while legacy SaaS multiples — public and private alike — stay under pressure unless a name can demonstrate real AI revenue monetization.
Top 5 Investment Trends — 2026 YTD What's happening
Investment concentration. AI is absorbing nearly all new capital. Generative AI funding is up 146% YoY to $136B; enterprise software (52% of all VC dollars) is itself ~70% weighted toward AI-adjacent data, infrastructure, and analytics.
Funding structure. Mega-rounds are swallowing the category. The top 20 enterprise software deals claimed 41% of all funding in it, and 8 of the 10 largest financings in history happened in the last ~13 months (OpenAI $110B, Anthropic $30B, Waymo $16B).
Valuation divergence. Public SaaS and private AI are moving in opposite directions. median EV/Sales down to 3.1x (-40% YoY), while SpaceX, OpenAI, Anthropic, Stripe, and Databricks now rank among the world's 15 most valuable software companies.
Liquidity. Secondaries became the release valve. A $225B secondary market is letting late-stage companies get price discovery without an IPO.
Capital discipline. Monetization is now the bar, not the story. Capital is increasingly gated on revenue proof rather than narrative.
Top 5 M&A Deal Themes — 2026 YTD What's happening
Deal sentiment. Barbell dealmaking. Activity is concentrated at the extremes (transformational megadeals plus small capability tuck-ins), with the middle market bifurcating. H1 2026 deal value hit ~$1.6T, up 28% YoY, though sentiment remains below historical norms.
Sector bifurcation. Assets vs. applications split. Hardware, hard assets, industrial, data compute and energy command premiums while legacy SaaS trades at compressed multiples, drawing buyers into quality names at a discount.
Sector activity. Security compliance consolidation. Firms are racing to create and be the new stack leaders.
Sponsor activity. PE take-privates hunting discounted SaaS. Sponsors are circling depressed-multiple assets with explicit post-close AI value-creation thesis — the same dynamic is still-unresolved for Main Street and middle-market.
Deal mechanics structures and terms. Hybrid, non-M&A deal structures. Commercial-partnership-plus-acquisition-option deals (SpaceX's $60B option on Cursor), JVs, acquihires, minority stakes, and earnouts are increasingly used in place of straight acquisitions to manage valuation uncertainty.
Coming Next - Five trends were monitoring signals for insights
What we're digging into next
Where the AI value-creation thesis actually creates results. Sponsors are circling …. depressed-multiple PE-backed SaaS is betting AI can restore growth post-close — almost nobody has a published track record yet. Which categories plausibly get real AI lift versus which are just cheap for a reason.
Whether the public correction has reached private middle-market pricing yet. The gap either closes or reveals the two markets were never that connected — probably our highest-value research thread given DealNet's private-deal data.
Consolidation plays in the “orphaned” tuck-in tier. IT Services & Outsourcing (2.23x, our largest bucket by count) plus the barbell-market pattern suggests serial acquirers — Banyan, Volaris, Xeinadin, the roll-up sponsors already in our DealNet data — are quietly active.
Sources and citation notes:
[1] The SaaS Capital Index , published since 2008, currently includes 63 publicly listed companies listed on USA exchanges. Excludes holding companies like Microsoft, Square, Oracle, Constellation Software, and excludes small firms and excludes mixed revenue steams like non SaaS, and SaaS consolidators. https://saasvaluationmultiple.com/saas-capital-index
SoftwareMultiples.com, a live-tracking tool cohort reads of 6.8x for higher-growth SaaS and 3.9x for higher-profitability SaaS
Jamin Ball's Clouded Judgement, 7.31.26 - AWS CapEx ROI, carries current multiple data as of end-July: overall median 3.8x NTM revenue, top-5 companies at 29.6x, and a growth-tier breakdown — high growth (>22%) at 19.5x, mid growth (15–22%) at 5.2x, low growth (<15%) at 3.0x. That 3.8x lines up closely with the SaaS Capital Index figure.
The SaaS Sentinel's SaaSpocalypse 2026: What Happened to SaaS and Where the Market Stands Now retrospective
[2] $12.3B take-private, announced in August 2025 and expected to close in early 2026, priced at a 32% premium to Dayforce's undisturbed share price. Against roughly $1.89B in trailing revenue, that works out to about 6.5x
